Hawkeye Volume Indicator MT4: Read the Market’s Intent Through Volume
If you’ve traded long enough, you’ve probably noticed that price alone can be pretty deceiving. A breakout candle looks massive… until it fizzles. A dip looks scary… until buyers step in. The missing piece? Volume context. The Hawkeye Volume Indicator V1.0 for MT4 brings that context front and center by combining tick volume with candlestick structure and close behavior, then painting a distinctive color-coded histogram that’s quick to read and surprisingly informative. Instead of guessing, you see when participation is rising or falling, when pushes are genuine or hollow, and when a trend is running on fumes.
Below, we’ll dive deep into what Hawkeye Volume does, how to use it across timeframes (from M15 to D1), the best pairs, practical strategies, setup steps, risk notes, and pro tips. Whether you scalp, day-trade, or swing, this guide will help you get the most out of it.
What Is the Hawkeye Volume Indicator?
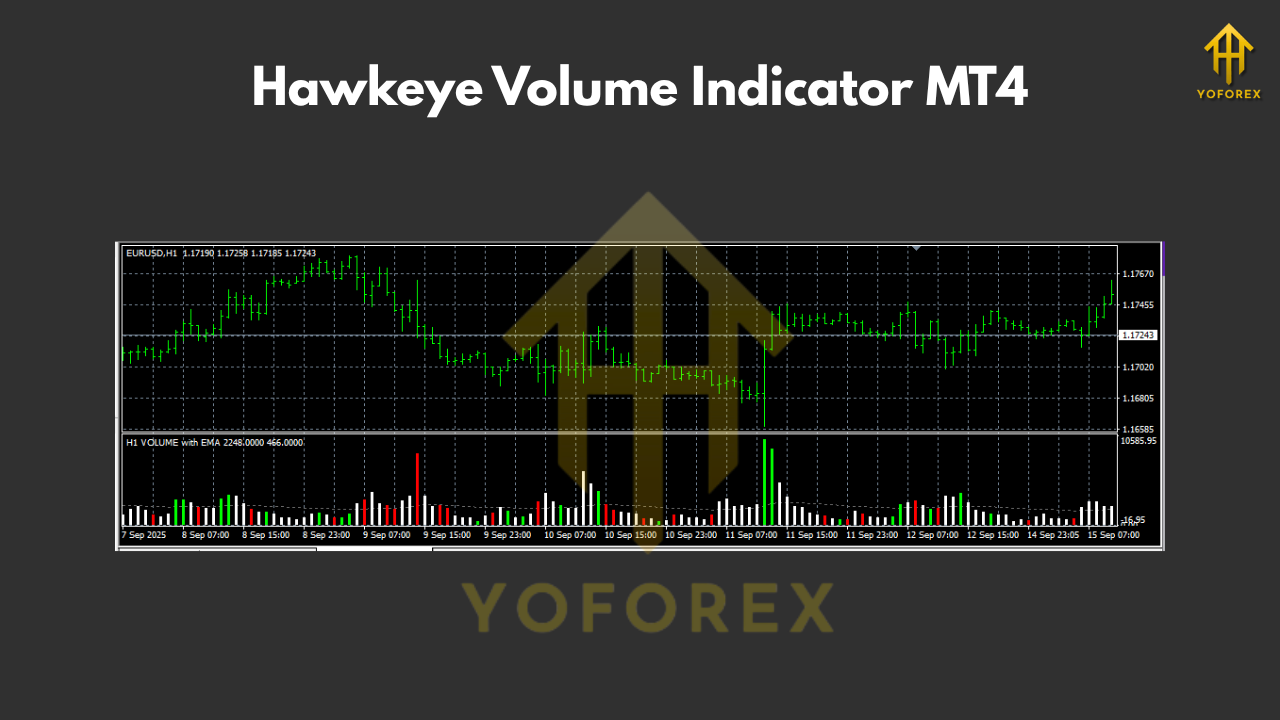
Hawkeye Volume is an advanced oscillator for MetaTrader 4 (MT4) that goes beyond a basic tick volume bar chart. It interprets candle structure (open-high-low-close) and close location along with the raw tick count to classify volume as bullish, bearish, or neutral/exhaustive—then shows those readings as colored histogram bars beneath price.
Why that matters:
Two candles with the same range can mean totally different things if the volume signatures diverge. Hawkeye’s logic helps you distinguish true conviction (strong participation pushing price) from low-quality moves (thin liquidity fakeouts). That’s crucial at support/resistance, breakouts, pullbacks, and trend continuations.
At a glance:
- Green / Yellow tones → rising bullish participation, often seen on trend continuations or accumulation near support.
- Red tones → rising bearish participation, distribution at resistance, or breakdown confirmation.
- Muted/neutral → apathetic flows; breakouts on low volume are at higher risk of failure.
Best Currency Pairs for Hawkeye Volume
Hawkeye works on any symbol where MT4 provides tick volume, but it shines where liquidity is robust and the tape (flow) is meaningful.
Major pairs (recommended):
- EUR/USD, GBP/USD, USD/JPY, AUD/USD, USD/CAD, USD/CHF, NZD/USD
These typically deliver cleaner volume-price relationships thanks to tighter spreads and deeper liquidity.
Liquid crosses (conditional):
- EUR/JPY, GBP/JPY
Tradable during active sessions (e.g., London/Tokyo overlaps). Expect more volatility; volume spikes here can be especially telling at session opens.
Avoid exotics/illiquid pairs:
Tick volume can be erratic and less representative of true participation, leading to more false reads.
Recommended Timeframes & How to Use Them
Hawkeye is multi-timeframe friendly, but its signal quality depends on how you apply it.
M15 to H1 (Scalping & Intraday)
- Scalpers (M15/M30): Hunt for short, fast moves. Use Hawkeye to validate micro-breakouts, pullback entries, and V-reversals only when volume agreement is present.
- Example: Price tags a known support, forms a higher low, and Hawkeye prints consecutive green/yellow bars → short-term long scalp case strengthened.
- Opposite: At intraday resistance, a rejection candle with expanding red bars supports quick short fades.
- Intraday (H1): A sweet spot to reduce noise while staying actionable.
- Example: Price breaks resistance on large, consistent green/yellow volume bars—intraday long continuation is more credible.
- Caution: If price breaks but volume stays muted, be wary of bull traps.
H4 to D1 (Swing & Trend Following)
- Swing traders (H4/D1): Use Hawkeye to confirm trend structure, breakouts from multi-day ranges, and reversal interest at major levels.
- Example: In a D1 downtrend with dominant red bars, a move into key support that flips to clustered green/yellow bars can signal accumulation and an impending bullish rotation.
Avoid Using M1/M5 in Isolation
- Ultra-low timeframes are noisy; tick volume often whipsaws. If you must use M1/M5, anchor your bias on higher timeframe (H1/H4/D1) Hawkeye reads and strong S/R.
Key Features (What Traders Love)
- • Volume with context: Not just ticks—candle close and structure are considered.
- • Color-coded conviction: Spot bullish/bearish drive instantly via histogram colors.
- • Multi-timeframe clarity: Works from M15 scalps to D1 swings.
- • Breakout filter: Confirms or questions breakouts based on true participation.
- • Pullback validator: Enter pullbacks only when volume resumes with the trend.
- • Divergence hints: Price makes a new high but volume doesn’t? Caution—momentum may be fading.
- • Liquidity awareness: Excels on major pairs with rich flow.
- • Flexible confluence: Pairs well with S/R, moving averages, structure, and candlestick patterns.
- • Easy visual read: Fast decisions, less overthinking during live markets.
- • Works on MT4: Lightweight and compatible with most MT4 setups.
Strategy Playbook (Step-by-Step Use Cases)
1) Breakout Confirmation
- Mark range highs/lows or trendline breaks.
- When price breaks, check Hawkeye: are bars expanding green/yellow (bull) or red (bear)?
- If volume expands with the break, consider entries on retest or continuation.
- If volume is weak/neutral, expect fakeouts—either stand aside or fade with tight risk.
2) Pullback Continuation
- Identify trend on H1/H4.
- Wait for a pullback to a dynamic level (MA) or structure (prior swing).
- Enter when price re-aligns with the trend and Hawkeye flips to strong trend color (green/yellow in uptrends, red in downtrends).
- Place stops beyond structure; target prior high/low or measured move.
3) Reversal at S/R
- On D1/H4, mark key zones.
- Watch for exhaustion: price tests the zone repeatedly, but Hawkeye fails to confirm further push (e.g., new low on weaker red).
- Look for shift (e.g., bullish candle with expanding green/yellow).
- Enter with a tight invalidation; partials at first trouble area (FTA).
4) Session Timing Edge
- During London/NY session opens, volume naturally increases. Combine session timing with Hawkeye spikes to catch quality impulses—but avoid chasing; wait for a controlled entry (retests/pullbacks).
Practical Examples
- H1 Breakout Long (EUR/USD): Consolidation just below resistance. On breakout, two consecutive green/yellow Hawkeye bars expand; enter on minor pullback; stop below the breakout base; scale at 1R, trail remainder.
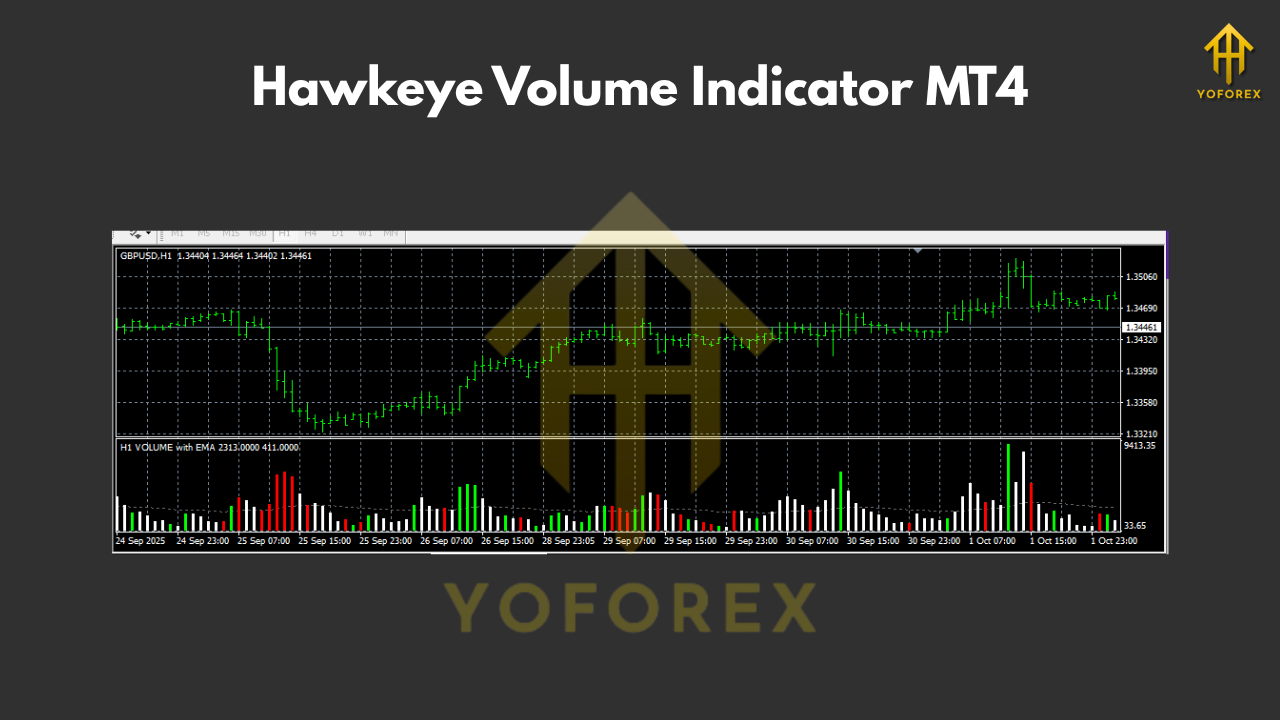
- H4 Reversal Short (GBP/JPY): After a steep rally, price prints a long upper wick into weekly supply with large red Hawkeye bars—bearish participation appears. Short on the lower high; stop above wick; target prior demand.
Installation & Setup (MT4)
- Download the indicator file (ex4).
- In MT4, go to File → Open Data Folder.
- Navigate to MQL4 → Indicators and paste the file.
- Restart MT4 (or refresh the Navigator).
- Attach Hawkeye Volume to your chart (Navigator → Indicators).
- Input settings:
- Colors: Keep defaults until you internalize the palette.
- Sensitivity: Start neutral; tweak only after live observation.
- Alerts (optional): Configure alerts for volume surges on your trading TF.
Tip: Save a template (right-click chart → Template → Save) so you can load your preferred layout quickly.
Settings & Optimization Tips
- Timeframe alignment: Decide a primary TF (e.g., H1 for intraday, H4/D1 for swings). Use one lower TF (e.g., M15) only for entry timing.
- Pair selection: Stick to majors for consistency. If you trade crosses like GBP/JPY, accept higher volatility and adjust stop distance accordingly.
- Confluence stack: Combine Hawkeye with clear S/R, a 20/50 EMA structure, and wick behavior. Volume + structure beats volume alone.
- Avoid overfitting: Don’t relentlessly tweak parameters after every losing trade. Gather a meaningful sample (at least 30–50 trades) before changing rules.
Risk Management (Non-Negotiable)
- Place stops beyond invalidation (not just a fixed number).
- Risk a fixed % per trade (e.g., 0.5%–1%).
- Take partials at logical levels, then trail behind structure or a short EMA.
- Skip trades when volume contradicts your thesis (e.g., bullish setup with rising red bars). No FOMO.
Common Mistakes to Avoid
- Chasing green bars: High bullish volume at the end of a move can be a blow-off. Wait for the next structure cue.
- Ignoring higher TF: An M15 long into a D1 resistance with heavy red on D1 is asking for trouble.
- Trading every spike: Not all spikes are equal—look for location (S/R) and structure to filter.
Final Thoughts & Action Plan
Hawkeye Volume Indicator MT4 gives you a deceptively simple visual for a complex concept—market participation. Use it to validate moves, filter low-quality breakouts, and time entries on pullbacks. Start with majors, pick one primary timeframe, and journal results for at least a month. You’ll quickly feel the difference between price moves that matter and those that don’t.
Comments
Leave a Comment